
The Whatcom County Pest Calendar
This calendar is built from Sasquatch Pest Control's own completed job records across Whatcom and Skagit counties — three years, 16,368 jobs, counted by pest and by month. It is not a regional estimate or a national seasonal chart. It is what one company was actually called out for here.
Call 360-410-2199 Request a free inspection
The short version
| What the data is | Completed job records from one pest control company working Whatcom and Skagit counties |
|---|---|
| Period covered | 1 January 2023 to 31 December 2025 — three full years |
| Jobs counted | 16,368 completed, of which 2,777 reactive pest jobs form the calendar |
| Where the work was | 94% Whatcom County, 4.5% Skagit, the rest Island and Snohomish |
| Commonest single pest | Odorous house ants — 1,624 jobs, 59% of all reactive pest work in three years |
| When people first call | 42% of a year's new customers arrive in July, August and September; 7% in January and February |
| Sharpest season | Wasps — 77% of a year's wasp work falls in July, August and September |
| Flattest | Bed bugs and cockroaches, which show no meaningful season at all |
- Find the month you are in and read the pests listed against it — those are what this county actually calls about now.
- Look one month ahead as well, because almost everything here is cheaper to prevent than to treat.
- Check whether your pest has a sharp season or a flat one; the sharp ones have a narrow window where prevention pays.
- Treat a flat line as a sign the pest is indoors and year-round rather than as a sign it is rare.
- Follow the links from each pest into the service or species page for what to actually do about it.
What this is
A count of what one pest control company in Whatcom County was actually called out for, month by month, from its own completed job records. Three years, 2023 through 2025, 16,368 completed jobs.
Every seasonal pest calendar you can find for this region is either a national chart with the state name changed or somebody’s recollection. Neither is much use here. Whatcom County has a maritime climate with wet winters and a short dry summer, a housing stock heavy on vented crawlspaces, and a rural edge of farms, woodland and seasonal cabins. The pest year that produces is genuinely different from the one a national template describes.
So this page does the only honest version. It counts the jobs.
How it was counted
Worth setting out before any figure, because a number without its method is decoration.
What is in the calendar. Reactive, pest-specific jobs — somebody had a problem, called, and we attended. That is 2,777 jobs across the three years, and it is the subset that actually tells you something about the county.
What is deliberately left out. Two things. Recurring plan stops, which are the bulk of the book. And free call-backs — the return visits that come with an active program at no charge, whether that is a trap check or a re-treatment. There were 2,172 of those across the three years, and every one of them is a second visit to a problem already counted. Including them would count the same problem twice and inflate whichever months we happened to be busiest in.
On the recurring stops: A monthly rodent service visit in March happened because it was scheduled for March, not because anything happened in March. Those stops ran between 176 and 254 a month across the whole period — a flat line that is a timetable rather than a season. Including them would drown the signal.
Why percentages rather than counts. Each pest below is given as the share of that pest’s annual work falling in each month. The shape of the year is the useful part; our job volume is not, and publishing it would tell you about our business rather than about your house.
The limitation that matters most. This measures when people call, which is close to but not the same as when a pest is most active. The clearest case is wasps: a nest counted in August has usually been there since May, and what changed in August is that somebody mowed over it. Where that gap is large, the entry says so.
Who is in it. Customers across Whatcom and Skagit counties — 94% Whatcom, 4.5% Skagit, the remainder Island and Snohomish. It reflects one company’s customer base rather than the county as a whole. That is a real limitation and an honest one.
What is not here. Species we were called out for fewer than about twenty-five times in three years. Three jobs does not describe a season, and drawing a curve through three dots would be inventing a pattern. Those pests are still covered properly in the pest library — they just do not have enough of a record here to chart.
The pests with a sharp season
Three of them, and all three reward acting early.
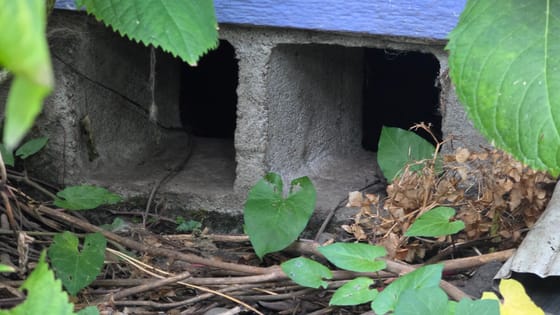
Wasps and yellowjackets — the sharpest curve in the data
| Jan | Feb | Mar | Apr | May | Jun | Jul | Aug | Sep | Oct | Nov | Dec |
|---|---|---|---|---|---|---|---|---|---|---|---|
| 0% | 0% | 0% | 3% | 5% | 12% | 31% | 33% | 13% | 3% | 1% | 0% |
Seventy-seven percent of a year’s wasp work falls in July, August and September. January through March is zero — not nearly zero, zero.
This is the clearest illustration of the gap between activity and calls. The colony starts in spring as a single overwintered queen and builds quietly through June. It is at its largest in August, which is also when the workers switch from hunting protein to seeking sugar and start appearing at barbecues and bins. Nothing sudden happens to the wasps in July. What happens is that people meet them.
The practical consequence is that the useful window is April to June, when a nest is small and findable and nobody has been stung yet. By the time this curve spikes, you are dealing with thousands of insects.
Where to go next: wasp control, wasps and hornets of Washington, and yellowjackets nesting in the lawn.
Spiders — a September problem and nothing else
| Jan | Feb | Mar | Apr | May | Jun | Jul | Aug | Sep | Oct | Nov | Dec |
|---|---|---|---|---|---|---|---|---|---|---|---|
| 0% | 0% | 4% | 0% | 0% | 19% | 4% | 19% | 38% | 12% | 0% | 4% |
Thirty-eight percent in September, and seventy-seven percent across June, August and September combined.
This is a small sample — spider jobs are uncommon because most spider calls end with an identification rather than a visit — but the shape matches what the entomology predicts exactly. The autumn rise is mature males walking to find females, not spiders coming in from the cold, and it tapers off on its own by November.
Worth noting what the data does not show: any winter spider work at all. The idea that spiders move indoors when it gets cold does not survive contact with three years of job records.
Where to go next: spider control, common spiders in Washington state, and spiders appearing every fall.
Fleas — a July peak with a December tail
| Jan | Feb | Mar | Apr | May | Jun | Jul | Aug | Sep | Oct | Nov | Dec |
|---|---|---|---|---|---|---|---|---|---|---|---|
| 6% | 0% | 0% | 0% | 9% | 6% | 26% | 15% | 18% | 3% | 3% | 15% |
Fifty-nine percent across July, August and September, which is the warm-weather pattern everybody expects — and then an unexpected 15% in December.
The December figure is the interesting one, and the explanation is a heated house. Flea pupae can sit dormant in carpet and bedding for weeks, and warmth plus vibration is what brings them out. A home that fills up with people over the holidays, with the heating on, is exactly those conditions. The problem started in summer; it finishes in December.
Where to go next: flea control and cat flea.
The pests with a long season rather than a sharp one
Odorous house ants — the commonest problem in this county, by a distance
| Jan | Feb | Mar | Apr | May | Jun | Jul | Aug | Sep | Oct | Nov | Dec |
|---|---|---|---|---|---|---|---|---|---|---|---|
| 4% | 5% | 8% | 10% | 11% | 11% | 10% | 9% | 9% | 8% | 7% | 7% |
One thousand six hundred and twenty-four jobs across three years — fifty-nine percent of every reactive pest call in this calendar, and more than carpenter ants and wasps put together. If you want one number from this page, it is that one. The commonest pest problem in Whatcom County is a small brown ant in the kitchen.
The curve rises through spring to a May and June plateau and then declines slowly, and the important feature is the floor rather than the peak: January, the quietest month of the year, still carries four percent. It never stops.
That shape is what a long-lived indoor-and-outdoor ant produces. Colonies become active and start foraging indoors as the ground warms, which gives the spring climb, but odorous house ants will nest in a wall void, under insulation, beneath a slab or in a crawlspace quite happily through winter — so the work never falls to zero the way wasp work does.
The practical reading: there is no ant season here to prepare for, because it is nearly always ant season. What there is instead is a spring window where dealing with the trail properly costs less than dealing with it in July.
Where to go next: odorous house ant, ant and carpenter ant control, and ant trails across the kitchen counter.
Carpenter ants — nine months, no real peak
| Jan | Feb | Mar | Apr | May | Jun | Jul | Aug | Sep | Oct | Nov | Dec |
|---|---|---|---|---|---|---|---|---|---|---|---|
| 3% | 4% | 7% | 9% | 11% | 12% | 10% | 13% | 10% | 7% | 7% | 6% |
This is the second-largest line in the calendar and the flattest curve of any pest with real volume. August is the peak at 13%, which is barely a peak at all — the work runs from March through October at roughly even weight and never fully stops.
That is a genuinely useful finding and it runs against how carpenter ants are usually described. They are not a spring problem. They are a building problem, and a building with wet wood in it produces work in every month of the year. The spring swarmer flight is what makes people notice, but the colony was there in November too.
Which means there is no clever window to catch this one in. If you have carpenter ants, the month is irrelevant and the moisture is not.
Where to go next: ant and carpenter ant control, carpenter ant, and sawdust piles below the trim.
Powderpost beetles and wood-boring pests
| Jan | Feb | Mar | Apr | May | Jun | Jul | Aug | Sep | Oct | Nov | Dec |
|---|---|---|---|---|---|---|---|---|---|---|---|
| 3% | 0% | 0% | 10% | 13% | 13% | 17% | 17% | 10% | 10% | 0% | 7% |
A broad April-to-October spread, peaking in midsummer, which tracks adult emergence — the exit holes and the frass appear when the beetles leave the wood, and that is when anybody notices.
Where to go next: wood-boring bee and beetle control and anobiid powderpost beetle.
Ants other than carpenter ants
| Jan | Feb | Mar | Apr | May | Jun | Jul | Aug | Sep | Oct | Nov | Dec |
|---|---|---|---|---|---|---|---|---|---|---|---|
| 2% | 0% | 10% | 17% | 10% | 21% | 2% | 5% | 19% | 0% | 5% | 10% |
Pavement ants and moisture ants, with a spring rise and a second bump in September. Small numbers, so treat the shape loosely — but the two-peak pattern is consistent with what moisture ants do here, which is appear whenever water does.
Where to go next: moisture ant and moisture ants mean a water problem.
What is under the line, and why it is not charted
Four pests cleared fewer than twenty-five jobs across the three years: voles at twelve, carpet and pantry beetles at six, termites at three and silverfish at three.
Those are left uncharted on purpose. Twelve jobs spread over thirty-six months cannot describe a season, and drawing a twelve-point curve through them would manufacture a pattern out of noise — which is precisely the thing a page like this exists to avoid. What the vole figures hint at, for what it is worth, is a growing-season problem: people notice damage to lawn, root crops and young tree bark while they are out in the garden, and stop noticing when they are not. That is a hint, not a finding, and it is written here as one.
All four are covered properly in the library regardless — vole, carpet beetle, silverfish and Pacific dampwood termite.
The pests with no season at all
This is the part of the calendar most worth reading, because the absence of a pattern is itself the finding.
Bed bugs
| Jan | Feb | Mar | Apr | May | Jun | Jul | Aug | Sep | Oct | Nov | Dec |
|---|---|---|---|---|---|---|---|---|---|---|---|
| 8% | 16% | 8% | 11% | 3% | 5% | 8% | 13% | 13% | 3% | 3% | 11% |
February is nominally the peak and it means nothing. Bed bug work is spread across every month of the year, which is exactly what you would expect from an insect that lives indoors, breeds indoors and travels on people rather than on weather.
Anybody telling you bed bugs have a season is describing travel patterns rather than biology. The useful signal is not the month; it is whether somebody has been away.
Where to go next: bed bug control and bed bugs after a trip.
Cockroaches
| Jan | Feb | Mar | Apr | May | Jun | Jul | Aug | Sep | Oct | Nov | Dec |
|---|---|---|---|---|---|---|---|---|---|---|---|
| 7% | 11% | 7% | 4% | 6% | 11% | 19% | 7% | 4% | 13% | 7% | 4% |
A mild July figure, otherwise flat. The German cockroach — which is nearly every real infestation here — lives in heated buildings year-round and has no outdoor season to follow. A kitchen is a tropical climate in February as much as in July.
Where to go next: cockroach control and are there cockroaches in Washington?.
Rodents, which are not charted here at all
Rodent work is the largest part of what we do and it is almost entirely on recurring plans, so it does not appear in this calendar. What the plan stops show is a flat line between roughly 176 and 254 visits a month, drifting upward through October, November and December.
That upward drift is the only seasonal signal in it, and it is a small one. It matches what everybody expects — rodents move toward warm buildings as the weather turns — but it is a gentle slope rather than the cliff the wasp data shows.
Where to go next: rodent control, rats and rodents in Washington state, and sealing a building before fall.
When people first call, which is a different question
Everything above counts jobs. This counts new customers — the month in which somebody who had never called us before decided they had a problem.

| Jan | Feb | Mar | Apr | May | Jun | Jul | Aug | Sep | Oct | Nov | Dec |
|---|---|---|---|---|---|---|---|---|---|---|---|
| 4% | 3% | 6% | 7% | 10% | 10% | 14% | 13% | 14% | 8% | 6% | 5% |
891 new customers across 2025. Forty-two percent of a year’s new customers arrive in July, August and September; seven percent arrive in January and February combined.
Two things make this worth having beside the job counts.
It is independent of our schedule. A job happens when we can get there. A new customer appears the day somebody decides the problem is bad enough to pay somebody. That is as close to a pure demand signal as this data gets.
And it corroborates the job curve from a different direction. The reactive job data peaks in July and August; new customer sign-ups peak in July, August and September. Two measurements, one shape, and neither was derived from the other.
One honest limitation: this is a single year, where everything above is three. It is published because 891 customers across twelve months is a reasonable sample and because the shape matches four other years we have seen charted — but it is a one-year figure and it is labeled as one. It becomes a multi-year average at the next annual update.
The month-by-month short version
January and February. Quietest months of the year for reactive work. Rodent plan stops at their winter level, a little bed bug work, essentially no wasps or spiders.
March. Odorous house ant work climbs sharply — the single biggest monthly jump in the calendar. Carpenter ant work begins to rise with it.
April and May. Odorous house ants reach their peak at 11%, carpenter ants rising, first wasp calls appear, powderpost beetle work begins. The cheapest month of the year to deal with a wasp nest is in here somewhere.
June. Odorous house ants at their plateau, pavement and moisture ants at their peak. Wasp work reaches 12% of its year. Spider work starts.
July and August. The busiest stretch by a distance. Wasps at 31% and 33%, carpenter ants at their nominal peak, fleas at 26%, powderpost beetles at 17%.
September. Spiders at 38%, their single biggest month. Wasps falling but still 13%. Fleas still high. Voles peak.
October. Everything falls away sharply. Rodent plan stops begin their winter climb. The sealing window is closing.
November and December. Reactive work near its floor, except fleas, which produce an odd 15% of their year in December from pupae waking in heated houses.
Using this
If you are a homeowner, the useful move is to read one month ahead rather than the month you are in. Almost everything on this calendar is cheaper to prevent than to treat, and for the sharp-season pests the prevention window closes before the problem becomes visible — which is the whole argument of sealing a building before fall and of the Whatcom County pest year, which is the written version of the same year.
If you are a reporter, a researcher or another company working this region, the figures here are free to use with attribution and a link. The full monthly table is available on request, and we would rather it was quoted accurately than approximated.
And if a month here does not match what you are seeing at your own property, that is worth a phone call rather than a shrug. The calendar describes a county. Your building has its own reasons.
Frequently asked questions
Where does this data come from?
From our own completed job records across Whatcom and Skagit counties, exported and counted. Three years, 16,368 completed jobs. Every figure is a count of work we were actually called out for. Nothing here is modeled, estimated from regional averages, or taken from a national pest chart.
Does this include customer information?
No. The underlying export carries customer details because that is how the software writes it, and that file never leaves our own machines. What is published here is counts by pest by month. No names, no addresses, no invoice values, nothing identifying anybody.
Does a busy month mean that pest is worse that month?
Usually, but not always, and the difference matters. Call volume reflects when people notice a pest as much as when it is most active. Yellowjackets are the clearest case: the nest has been there since spring, and August is when somebody walks into it.
What is the most common pest in Whatcom County?
Odorous house ants, and it is not close. They account for 1,624 jobs across three years in these records — fifty-nine percent of all reactive pest work, more than carpenter ants and wasps combined. The small brown ants trailing across a kitchen counter are the defining pest problem of this county.
When do most people call a pest control company here?
July, August and September. Across 891 new customers in 2025, 42% first made contact in those three months, against 7% across January and February combined. That matches the reactive job data, which peaks in the same stretch, and the two measurements are independent of each other.
Why are rodents not in the calendar?
Because almost all rodent work here runs on recurring plans rather than one-off calls, and a scheduled visit tells you about the schedule rather than about the pest. Those plan stops ran between 176 and 254 a month across three years, which is a timetable, not a season.
How often is this updated?
Once a year, with the previous year's completed jobs added and the shares recalculated. The review date on this page is when it is next due, and the period covered is stated above so you can see how current the figures are.
Can I use these numbers?
Yes, with attribution and a link back to this page. If you are a reporter, a researcher or another company working this region and you want the full monthly table rather than the summary, get in touch and we will send it.
Sources
- PNW Insect Management Handbook — structural and health pests — read November 12, 2026
- WSU Pestsense — full alphabetic pest list — read November 12, 2026
Rules change. This page is scheduled for review against its sources by November 12, 2027. If you are reading it after that date and something looks out of step with the current rule, the rule is right and we are wrong — please tell us.
Related guides
Pest problem in Whatcom County?
Family-owned, no long-term contracts, and every treatment is backed by our 100% Service Guarantee.
Most calls in Whatcom County are out within 1–2 days, about 3 during the late-summer peak.
Last updated